For the first time in years, valuation-focused advisers have something to brag about as they approach the end of year.
This end-of-year period is when it’s traditional to review prior-year forecasts, celebrate successes and evaluate what went wrong with failures.
A year ago, I reported that the valuation models with the best track records were concluding that the stock market was extremely overvalued. The S&P 500 SPX, -0.25% has fallen 18% since then, and the technology-oriented Nasdaq Composite Index COMP, -0.11% is down 29%.
It would be premature for advisers who employ these models to break open their bottles of Champagne. They have been warning for years about an imminent bear market, and until this year they were wrong.
In prior years, they defended themselves by arguing that valuation models are not short-term indicators, and instead need to be judged over the long term. It’s not fair for them now, in the wake of a calendar year that finally followed their predicted bearish script, to suddenly focus on the short term.
The more intellectually honest exercise is to remind everyone that valuation models have little predictive power, if any, at the one-year horizon. To the extent their track records are impressive, it’s over much longer time horizons, such as a decade.
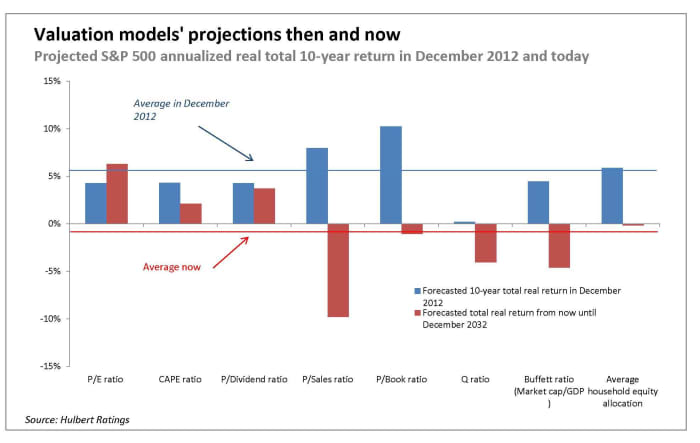
The accompanying chart shows, for the eight valuation models I regularly monitor in this column, what they were forecasting a decade ago. (Please see below.) On average, they projected that the S&P 500 would produce an inflation-adjusted and dividend-adjusted return of 5.2% from then until today.

I give that average prediction a passing grade. On the one hand, it was significantly lower than the 9.7% annualized total real return that the stock market actually produced from then until now.
On the other hand, these models correctly forecast that stocks would far outperform bonds. A decade ago, 10-year Treasuries TMUBMUSD10Y, 3.879% were projected to produce a negative 0.7% annualized real total return over the subsequent decade, based on their then-current yield and the 10-year breakeven inflation rate that then prevailed. As it turned out, 10-year Treasuries actually produced a negative 2.6% annualized real total return from then until now.
In other words, these valuation models 10 years ago were projecting that stocks would outperform bonds over the subsequent decade by an annualized margin of 5.9 percentage points. While a lot lower than the 12.3 annualized percentage point margin by which stocks in fact outperformed bonds, investors who followed these models’ lead presumably aren’t too upset for being steered away from bonds into stocks.
As you can also see from the chart, the average current 10-year stock market projection of these eight models is a total real return of minus 1.0% annualized. Not only is that a lot lower than the 5.2% average projection from a decade ago, it is even lower than the projected gain for 10-year Treasuries of 1.4% annualized above inflation. So these models currently are telling us that stocks’ return over the next decade will be a lot lower than the last one, and they may even underperform bonds.
How the valuation models stack up historically
The table below shows how each of my eight valuation indicators stacks up against its historical range. While each suggests a less overvalued market than what prevailed at the beginning of this year, they are not yet projecting a hugely undervalued market.
| Latest | Month ago | Beginning of year | Percentile since 2000 (100 most bearish) | Percentile since 1970 (100 most bearish) | Percentile since 1950 (100 most bearish) | |
| P/E ratio | 21.48 | 20.65 | 24.23 | 48% | 66% | 75% |
| CAPE ratio | 29.29 | 28.22 | 38.66 | 76% | 83% | 87% |
| P/Dividend ratio | 1.68% | 1.72% | 1.30% | 78% | 84% | 89% |
| P/Sales ratio | 2.42 | 2.33 | 3.15 | 90% | 91% | 91% |
| P/Book ratio | 4.02 | 3.87 | 4.85 | 93% | 88% | 88% |
| Q ratio | 1.70 | 1.64 | 2.10 | 88% | 93% | 95% |
| Buffett ratio (Market cap/GDP ) | 1.59 | 1.54 | 2.03 | 88% | 95% | 95% |
| Average household equity allocation | 44.8% | 44.8% | 51.7% | 85% | 88% | 91% |
Mark Hulbert is a regular contributor to MarketWatch. His Hulbert Ratings tracks investment newsletters that pay a flat fee to be audited. He can be reached at mark@hulbertratings.com.


:quality(70):extract_cover():upscale():fill(ffffff)/2025/01/30/866/n/1922564/5de1da7d679bd74385a671.79574530_Screenshot_2.png)


